When Nonpaged Pool looks high, first confirm the same category in RAMMap Use Counts and Windows memory counters. Record values at consistent intervals and repeat the workload. A single large value does not prove a leak, and RAMMap does not identify the allocation's driver or pool tag. If the value rises persistently, preserve the timeline and use PoolMon or a Windows Performance recording to narrow the kernel allocation. Avoid emptying standby lists or changing several drivers before you have comparable evidence.
What a high Nonpaged Pool value means
Nonpaged Pool is kernel memory that must remain resident in physical RAM while it is in use. Windows and kernel-mode components, including drivers, use pool allocations for work that cannot wait for a page to be brought back from storage. RAMMap groups this memory by use category; it does not expose every allocation stack or tell you which driver owns a growing allocation.
Interpret the number against installed RAM, uptime, Windows build, devices, and workload; no universal size proves a leak. Investigate a high Nonpaged Pool value that rises repeatedly and stays elevated, especially when available memory falls, paging increases, or responsiveness changes.
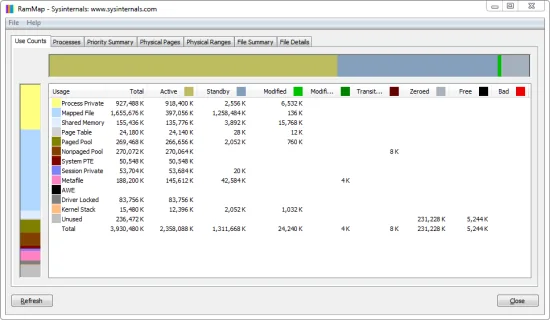
In RAMMap, open Use Counts and compare the Nonpaged Pool row with the other use categories and page-list states. Read the row and column together: a physical-memory category and a state such as Standby answer different questions. The RAMMap memory types guide explains those distinctions.
Confirm the category before changing anything
Start with the RAMMap ZIP from Microsoft's Sysinternals download page if you do not already have a verified copy. Open RAMMap with appropriate permissions, allow the view to populate, and use F5 to refresh before recording a baseline. Do not begin by selecting an Empty command; those commands change page lists and can make later comparisons harder.
Check the Task Manager Performance memory panel as a second view and note its Non-paged pool reading. For a longer observation, use Performance Monitor and record the Memory\Pool Nonpaged Bytes counter. The counter names shown here are English names and can be localized on other Windows installations. A counter confirms a time-based pattern; it still does not name the responsible driver.
Log Windows build, installed RAM, uptime, workload, time, and unusual devices or virtualization. Keep conditions consistent and save a baseline before reproducing the suspected trigger.
- 1. Refresh
Open Use Counts, press F5, and wait for the same view to settle.
- 2. Record
Save a snapshot and note Nonpaged Pool, available memory, commit, and the exact time.
- 3. Reproduce
Run one normal workload or device action without changing unrelated settings.
- 4. Compare
Refresh at fixed intervals, then check whether the value stabilizes after the workload stops.
Decide whether the pattern deserves escalation
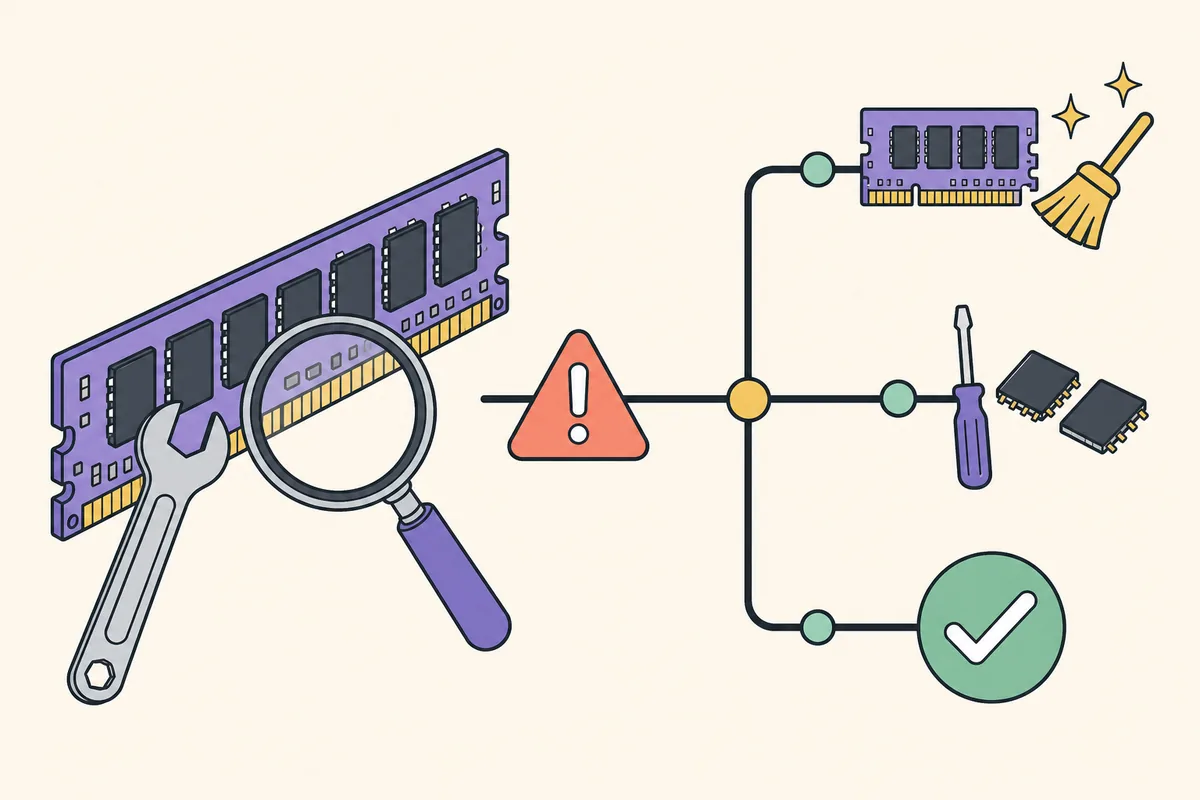
A single snapshot cannot distinguish a normal workload allocation from a leak. For a high Nonpaged Pool trend, repeat the same action, sample at consistent intervals, and include a quiet period afterward. A pool that rises during use and later settles is different evidence from one that climbs after each repetition and stays elevated when the system is idle.
Compare the pool with available memory, commit, paging, and symptoms. Stable behavior may call for monitoring; repeatable growth plus pressure or slowdowns justifies escalation. Keep snapshots and a workload log.
Keep reboot age comparable, record what changed and when, and repeat the trigger. A total change alone does not identify a driver fault.
| Observation | What it supports | Next step |
|---|---|---|
| One high reading | A category worth checking; not proof of a leak | Refresh and record a baseline |
| Rises during work, then settles | A workload-related allocation may be released | Repeat the same workload and compare |
| Rises across repetitions and stays high | A persistent allocation or leak is plausible | Preserve evidence and inspect pool tags |
| Growth with paging or instability | A system-level memory problem needs attention | Stop stress testing and escalate carefully |
Use PoolMon to narrow a persistent pool increase
PoolMon, distributed in the Windows Driver Kit, displays kernel pool tags and bytes; with a repeatable increase it can surface tags tied to growth. Get it through Microsoft's driver tooling, not an unknown mirror. Microsoft's PoolMon documentation lists its options.
Run it elevated for a focused session. The /b option sorts by bytes; confirm options in the installed tool's help. Record tag, pool type, bytes, allocations, frees, and time, then repeat the workload to identify tags that track the RAMMap total.
A tag is not necessarily a driver: tags may be shared, undocumented, or unmapped. Correlate it with a signed driver and a recent change; do not remove drivers or edit the registry from a short tag search alone.
poolmon.exe /bPoolMon is distributed with Windows driver development tools, not as a standard RAMMap screen. If it is unavailable or the tag is unclear, preserve the snapshots and ask an administrator or driver specialist to continue the investigation.
Correlate the tag with a safe driver investigation
Compare growth timing with device actions, service starts, driver updates, VPN or security software, storage, or virtual-machine work. Test one factor at a time. If the vendor offers a signed driver for the exact device and Windows build, follow its update or rollback process and record versions.
Windows Performance Recorder and Analyzer can trace system activity when suitable profiles and symbols are available. Use a focused recording only for reproducible issues that justify kernel tracing; traces can be large and should be handled as diagnostic data.
Driver Verifier can cause bug checks and is not a routine first step. Use it only with an administrator, a selected driver, and a recovery path. Ordinary triage should start with snapshots, counters, PoolMon, and supported driver updates.
- Save RAMMap snapshots and counter logs before updating or removing a driver.
- Record the exact device, driver provider, version, date, Windows build, and workload.
- Use the computer manufacturer's or device vendor's supported package and recovery instructions.
- If the machine becomes unstable, stop reproducing the load and involve an administrator or support team.
Avoid fixes that only change the visible number
Emptying the Standby list does not release a kernel driver's Nonpaged Pool allocation. Trimming working sets, running a RAM cleaner, or scheduling repeated cache clearing can change other memory categories while leaving the growing pool untouched. It can also discard useful evidence or make file access slower.
Avoid universal thresholds, unverified registry tweaks, and driver-removal tools. Change one supported driver at a time, keep the baseline, and retain a rollback path.
If RAMMap instead shows growth in Process Private or Mapped File, follow that category rather than pursuing pool tags. See the high Process Private guide, the high Mapped File guide, and the broader RAMMap memory leak workflow.
Choose the next step from the evidence you have
If high Nonpaged Pool is stable and the computer is responsive, keep a baseline and monitor the relevant workload. Repeated growth merits snapshots, a nonpaged-pool counter, and timing notes. Use PoolMon for changing tags; use a focused Windows Performance trace when a tag is not enough.
RAMMap classifies the issue and separates pool growth from standby cache, file-backed memory, and process-private growth. Start with how to use RAMMap and the memory type reference; keep raw evidence so another person can verify the trend.
Frequently asked questions
Can RAMMap identify the driver using Nonpaged Pool?
No. RAMMap can confirm the memory category and show its size, but it does not attribute each allocation to a driver. Use repeatable snapshots and pool-tag or performance-tracing tools for the next step.
Does one high Nonpaged Pool reading mean there is a leak?
No. A single value depends on the system and workload. Look for repeatable growth that remains after the workload stops and compare it with available memory, commit, paging, and symptoms.
Will Empty Standby List reduce Nonpaged Pool?
No. Standby is a different page-list state. Emptying it cannot release a kernel pool allocation and may only make file reads slower or remove useful evidence.
Where can I get PoolMon?
PoolMon is included with Microsoft's Windows Driver Kit tools. Use Microsoft's documentation and a trusted driver-tool installation; avoid standalone mirrors.
Should I run Driver Verifier to find the driver?
Not as a routine first step. Driver Verifier can intentionally trigger a crash. Use it only for a selected driver in a controlled recovery-ready environment and follow Microsoft's guidance.
What evidence should I send to support?
Include RAMMap snapshots, the time-based Nonpaged Pool counter, Windows build, uptime, device and driver versions, the workload steps, and whether the same steps reproduce the rise.
Get RAMMap from Microsoft
Get RAMMap from Microsoft's Sysinternals page before collecting a baseline.