Open RAMMap as administrator, record Total, Active, Standby, Modified, Free and the major Use Counts rows, then save a snapshot. Repeat one action at fixed intervals and refresh with F5. A likely leak is a repeatable upward trend that does not settle after the workload stops and is accompanied by falling available memory or rising commit. Follow Process Private to a process, pool growth to drivers and Mapped File growth to File Summary; RAMMap identifies the class of memory, while Process Explorer, VMMap, PoolMon or WPR identifies the owner.
How to know if the pattern is a memory leak or normal pressure
Windows intentionally uses unused RAM for file cache, standby pages, code and recently accessed data. A machine can show high memory usage while remaining healthy because much of that memory is reclaimable. A leak is different: an allocation category grows across comparable checkpoints, does not return after the responsible work finishes and eventually reduces available memory, raises commit or increases paging.
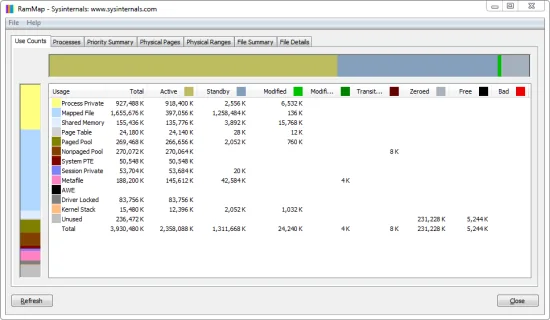
Do not diagnose from the Total column alone. Read each Use Counts row across Active, Standby, Modified and other states. A large Standby value usually describes cache that Windows can reclaim; growing Active Process Private or pool memory is a stronger lead. Also compare Task Manager's committed memory and system responsiveness so that a RAMMap trend is tied to actual pressure.
| Observation | Usually normal | Stronger leak signal |
|---|---|---|
| After workload starts | Memory rises and later plateaus | Memory rises after every identical repetition |
| After workload stops | Some memory is released or becomes reclaimable | The same category remains allocated and continues growing |
| Available memory | Stable enough for the workload | Falls steadily while commit or paging rises |
| Owner | Expected application, cache or service | One process, pool tag or file group grows without useful work |
| After restart | Warm-up pattern returns and stabilizes | The same reproduction steps trigger unbounded growth again |
Capture a clean RAMMap baseline before reproducing the problem
Close unrelated applications and pause updates, backups, browser downloads and virtual machines. Run the current Microsoft RAMMap build as administrator, wait for the system to become quiet and press F5. Record the Use Counts totals, the Active column, available memory, system commit and the time. Save a RAMMap snapshot before starting the suspect workflow.
Keep the environment comparable. Use the same application version, document, game level, browser profile or service configuration; wait the same interval at each checkpoint. If a test changes several variables at once, the resulting delta cannot tell you which action caused it. Avoid clearing caches between checkpoints because that destroys the baseline you need to compare.
Follow the RAMMap category that keeps growing
The category determines the next investigation. Process Private growth normally points toward an application or service. Mapped File growth calls for File Summary and File Details to identify file-backed pages. Nonpaged or paged pool growth is kernel memory and requires a driver-oriented workflow. Driver Locked, page tables and large pages each have different owners and should not be treated as interchangeable symptoms.
If two categories move together, compare their timing rather than choosing the larger one. An application may allocate private memory while also warming file cache; closing it may release private commit but leave useful standby pages. Read the RAMMap memory types guide when a label is unclear, and use the dedicated Process Private guide when that row is the sustained Active-memory source.
- Process Private: sort the Processes tab, record PID and private-memory change, then verify Private Bytes in Process Explorer or VMMap.
- Mapped File: sort File Summary by total and active pages, then inspect the exact path in File Details before blaming an application.
- Nonpaged or paged pool: record the trend, use PoolMon or WPR to identify a pool tag and map the tag to a signed driver.
- Standby: treat it as reclaimable cache unless pressure, repeated faults or a specific workload proves otherwise; clearing it is not a leak diagnosis.
Run a repeatable checkpoint test and compare snapshots
A useful test has a baseline and at least three comparable checkpoints. Save snapshots with descriptive names such as baseline, after-open-1, after-open-3 and idle-10min. Write down the exact action and timestamp. The important result is the delta per repetition and whether the value settles during the idle checkpoint.
Stop before the machine becomes unstable. Severe paging changes application timing and can make later checkpoints misleading. If the pattern is repeatable, restart only the suspected application or service when safe, repeat the same test and confirm whether the category begins growing again. A restart that temporarily frees memory is evidence of ownership, not a permanent fix.
- Save a quiet baseline
Refresh RAMMap, record available and committed memory, then save the first snapshot.
- Repeat one action
Perform one clearly defined operation without changing other applications or settings.
- Capture fixed checkpoints
Refresh and save after the first, third and fifth repetition, or at equal time intervals.
- Add an idle checkpoint
Stop the workload and wait long enough to see whether memory plateaus or returns.
- Confirm with the owner tool
Use Process Explorer, VMMap, PoolMon or WPR according to the RAMMap category.

Choose the right tool after RAMMap narrows the category
RAMMap explains physical memory composition; it does not show every allocation stack or driver call site. Once the category and timing are clear, switch tools. Process Explorer verifies process ownership and Private Bytes. VMMap breaks one process into heap, image, stack, mapped file and other address-space regions. PoolMon and WPR are better for kernel-pool and driver investigations.
Keep RAMMap snapshots, the process PID, pool tag, file path, exact reproduction steps and timestamps. This evidence is much more useful to a vendor or administrator than a screenshot saying that RAM is high. Dumps and traces can contain paths, document names and other sensitive data, so store and share them through an approved support channel.
| RAMMap clue | Next tool | Question it answers |
|---|---|---|
| Process Private | Process Explorer | Which process or service owns growing private commit? |
| One process confirmed | VMMap or vendor profiler | Which heap, stack, image or mapped region grows? |
| Nonpaged/paged pool | PoolMon | Which pool tag is consuming kernel memory? |
| Driver or timeline issue | Windows Performance Recorder | When does growth occur and which system activity matches it? |
| Mapped File | RAMMap File Summary/Details | Which file-backed pages account for the growth? |
Avoid cache-clearing fixes that hide the evidence
Empty Standby List removes reclaimable cache; it does not make an application release private commit or make a driver release leaked pool allocations. Empty Working Sets can trim resident pages and create a temporary visual drop, but the pages may fault back immediately while the underlying commitment remains. These actions can erase the comparison state and make a real leak harder to prove.
Use the Empty menu only for a controlled cache experiment, not as scheduled treatment. Update or restart the confirmed owner, disable a suspect extension or driver through official procedures and repeat the same checkpoint test. For production systems, capture evidence before restarting and follow the vendor's support process. The verified RAMMap release remains v1.63, published March 26, 2026; the official 737,190-byte ZIP and SHA256 were rechecked on July 30, 2026 against Microsoft sources.
A lower graph immediately after clearing cache or trimming working sets is not proof that a leak was fixed. Preserve the trend first, then correct the confirmed owner.
RAMMap memory leak FAQ
Can RAMMap prove that an application has a memory leak?
RAMMap can show a repeatable category trend and help identify a process, file or pool path, but process-level or driver-level tools are usually needed to prove the exact owner and allocation source.
Which RAMMap value should I watch for a leak?
Watch the row that repeatedly grows in Active memory together with available memory and system commit. Process Private, Mapped File and pool memory require different follow-up workflows.
How many RAMMap snapshots do I need?
Use a baseline, several equal checkpoints during the same action and an idle checkpoint. Three or more comparable deltas are stronger evidence than two unrelated screenshots.
Does Empty Standby List fix a memory leak?
No. It discards reclaimable cache and does not release private allocations or leaked kernel pool memory.
What should I use after RAMMap?
Use Process Explorer for ownership, VMMap for one process, PoolMon for pool tags and Windows Performance Recorder for a time-based system or driver investigation.
Download RAMMap v1.63 from Microsoft
Use the current official ZIP, preserve a quiet baseline and compare a repeatable workload before changing memory state.