

RAMMap does not continuously stream every memory change. Press F5 or use Refresh to request a new snapshot, then compare the same tab and columns under a repeatable workload. For second-by-second counters or long recordings, use Performance Monitor, Resource Monitor, Windows Performance Recorder or another purpose-built tool.
What RAMMap real-time monitoring actually means
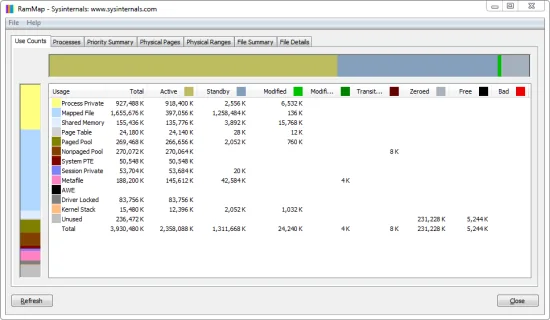
Each RAMMap view is a point-in-time classification of physical pages. The operating system keeps allocating, trimming, caching and repurposing pages after the window appears, so the displayed totals become older until you refresh. That makes RAMMap different from a scrolling performance chart.
A refresh asks RAMMap to enumerate memory again and rebuild the current view. It does not replay everything that happened between two refreshes, and a short spike can disappear before the next snapshot. Read the legend and selected tab after every refresh because Use Counts, Processes, File Summary and Priority Summary answer different questions.
Use a controlled refresh workflow
The useful unit is not the fastest possible refresh. It is a documented before-and-after pair around one event. Close unrelated applications when practical, choose the tab that matches the symptom, and write down the time and workload step. Then reproduce one action and refresh once the action reaches the checkpoint you care about.
Avoid pressing F5 repeatedly while also launching programs, copying files and clearing lists. Too many simultaneous changes make the result difficult to attribute. If a category grows, repeat the same test to see whether the direction is reproducible.
- Choose one question
Decide whether you are testing process-private growth, mapped files, standby cache, a kernel pool or another category.
- Capture the baseline
Open the relevant tab, press F5 and record the important totals or save a RAMMap snapshot.
- Run one workload
Start the application, file operation or repeatable task without changing unrelated settings.
- Refresh at a defined checkpoint
Press F5 after the same duration or event, then compare the same rows and columns.
- Repeat before concluding
A second controlled run separates a repeatable pattern from normal background fluctuation.
Compare RAMMap snapshots without inventing a trend
Saved snapshots preserve evidence better than screenshots of unrelated tabs. Name files with the workload and checkpoint, such as idle, after-load and after-close. When you reopen them, compare like with like: the same Windows session, RAMMap version, architecture, tab, sort order and workload state.
A higher number is not automatically a leak. Standby and mapped-file totals can rise because Windows is caching useful data. Process Private may fall after a working-set trim while committed memory remains. Use the RAMMap memory types guide before attaching a diagnosis to one color or column.
Know the limits of RAMMap refresh data
RAMMap is excellent for classifying physical pages, but it is not designed to retain a continuous time series. It can miss brief peaks between refreshes, and frequent enumeration can add its own overhead on a busy system. A refresh also cannot prove which code path caused a change.
Use the result as a narrowing step. If File Summary points to mapped data, continue with the high Mapped File workflow. If one process grows, use Process Explorer, VMMap or application diagnostics. If a pool grows, use PoolMon and driver evidence.
| Need | Best starting tool | Why |
|---|---|---|
| Current physical-page classification | RAMMap | Detailed use and page-list views |
| Live per-process overview | Task Manager or Resource Monitor | Continuously updated process counters |
| Long counter history | Performance Monitor | Sampling, logging and alerts |
| Event-based performance trace | Windows Performance Recorder/Analyzer | Timeline and stack-aware investigation |
Choose a refresh cadence that matches the symptom
For a launch spike, capture immediately before launch and after the application reaches a stable state. For a suspected gradual leak, RAMMap checkpoints every few minutes may help classify the growing category, but Performance Monitor or the specialized process tool should record the trend. For file-cache behavior, compare before access, after the first read and after a repeated warm-cache read.
Do not treat automatic cache clearing as monitoring. Empty commands modify the system you are trying to observe. Read the RAMMap clear cache guide and keep refresh-only observation separate from destructive tests.
Refresh first, record the evidence, and change memory state only when a documented test specifically requires it.
When to switch from RAMMap to another tool
Switch when you need continuous timestamps, alerts, call stacks, driver pool tags, per-process virtual allocations or an event trace. RAMMap should tell you which category deserves that deeper tool. It should not be forced into a recorder it was not built to be.
If the window freezes during enumeration, follow the RAMMap not opening and freezing checklist. For the broader sequence of tabs, baselines and handoffs, use the complete RAMMap usage guide.
RAMMap real-time monitoring FAQ
Does RAMMap update automatically in real time?
No. Use F5 or Refresh to request a new point-in-time view. The display does not preserve every change between refreshes.
How often should I refresh RAMMap?
Refresh at defined workload checkpoints. For continuous or second-by-second monitoring, use Performance Monitor, Resource Monitor or a tracing tool.
Can frequent refreshes slow the PC?
Enumeration has overhead, especially on busy systems. Avoid rapid refresh loops and compare a small number of well-defined checkpoints.
Can RAMMap prove a memory leak?
It can identify a category that repeatedly grows. Confirm the cause with the process, pool, driver or tracing tool appropriate to that category.
Should I empty standby memory before every snapshot?
No. That changes the memory state and destroys normal cache evidence. Empty a list only for a separate, controlled test.
Use the current official RAMMap build
Microsoft still publishes RAMMap v1.63 as a portable ZIP. The official source was rechecked on July 22, 2026.