
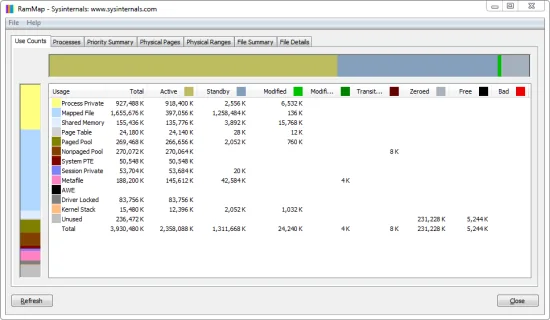
Mapped File RAMMap is easiest to read as a row plus a state. The row identifies file-backed physical pages; Active, Standby and Modified show what Windows can use now, reclaim later or write first. Check the distribution and workload before changing a list. Record Mapped File RAMMap beside its page state.
What a high Mapped File value means in RAMMap
Read Mapped File RAMMap as two dimensions: the usage row identifies file-backed physical pages, while Active, Standby and Modified show their current state. A high row total is not automatically a leak; the state distribution and the workload decide what to inspect next. Record Mapped File RAMMap beside its page state.
Windows deliberately uses otherwise idle RAM to cache file data because cached reads are faster than returning to storage. That behavior is normally beneficial. The important question is not whether the Mapped File total looks large, but whether those pages are reclaimable, actively referenced, modified, locked by a workload, or growing while available memory and responsiveness decline.
For a broader definition of every row and page-list column, use the RAMMap memory types reference. This page focuses only on the diagnostic path after Mapped File becomes the largest or fastest-growing category.
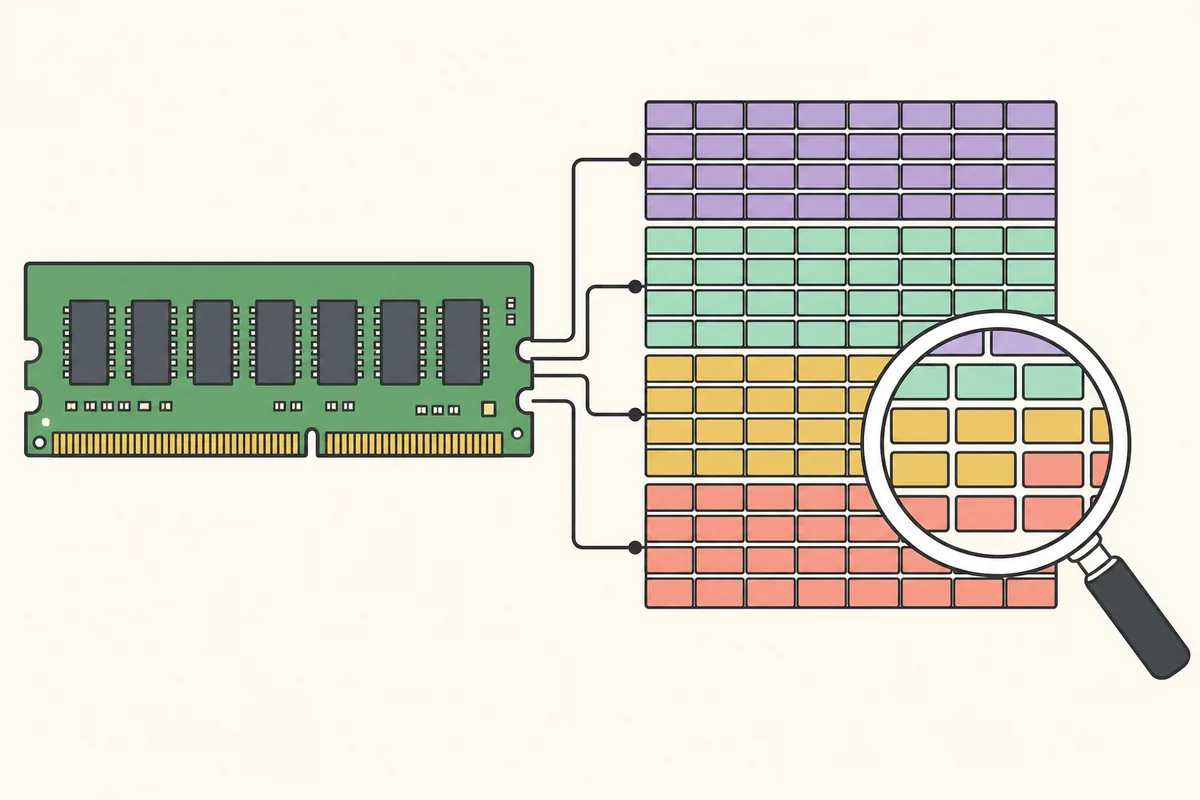
Read Active, Standby and Modified before trying a fix
Start on Use Counts and read across the Mapped File row. Standby pages hold cached data that can usually be repurposed when another allocation needs memory. Active pages are currently in working sets or otherwise in use. Modified pages contain changes that must be written before the page can be reused. These states require different conclusions and different tools.
Also compare the Windows Available memory value, commit pressure, paging activity and the symptom you are investigating. A machine can show several gigabytes of Mapped File on Standby and remain healthy. The same total is more concerning when Available memory stays low, hard faults rise, the system stalls, or the Active portion grows after a repeatable action.
| RAMMap pattern | Likely meaning | Next action |
|---|---|---|
| Mostly Standby; Available memory remains healthy | Normal or useful file cache | Leave it alone and verify that Windows reclaims it under demand. |
| Mostly Active and tied to a few large files | An application or service is actively mapping file-backed data | Use File Summary and File Details, then inspect the owning workload. |
| Modified grows with storage delay | Dirty file-backed pages are waiting for writeback | Check disk health, filter drivers, backup/security tools and the writing process. |
| Mapped File rises after every repeated task and does not fall | Persistent mapping, workload behavior or a leak-like pattern | Capture before/after snapshots and identify the file and process. |
| Standby is large but the symptom is compressed memory | Different memory category | Use the Windows memory compression guide. |
Find which files make Mapped File high
Do not begin with an Empty command. Build a baseline, reproduce the workload once and identify the files that changed. This converts a vague high-memory screenshot into evidence you can associate with an application, service, update, game, virtual machine, database, backup job or storage filter.
The general RAMMap workflow guide explains every major tab. For this problem, the shortest useful path is Use Counts to confirm the category, File Summary to rank files and File Details to inspect page ranges and states.
- Capture an idle baseline
Run RAMMap as administrator, select Use Counts, press Refresh and record Mapped File Active, Standby and Modified values together with Available memory.
- Reproduce one workload
Open the application, load the project or file, copy the data, run the scan, or perform the action that precedes the increase. Avoid changing several variables at once.
- Sort File Summary
Open File Summary and sort by Total, Active or Standby. Look for a small set of paths whose size and timing match the increase.
- Inspect File Details
Select a suspicious path and use File Details to see how its pages are distributed. Keep the file path, state and refresh time in your notes.
- Confirm the owner
Use Resource Monitor, Process Explorer, application logs or service configuration to connect the file to a process or component. RAMMap shows physical-page evidence, not every ownership relationship.
- Repeat and compare
Close or stop only the suspected workload, refresh again and compare the same columns. A repeatable change is stronger evidence than one snapshot.
Tell normal file cache from a real memory problem
Normal cache follows workload and gives memory back when pressure arrives. A large archive extraction, game launch, antivirus scan, file search, backup, media catalog or virtual disk can populate the standby list without creating a leak. Performance may even improve on the second read because the data is cached.
Investigate further when the active portion grows continuously, available memory remains low, storage latency or hard faults accompany the growth, one file path dominates unexpectedly, or closing the associated application does not release its mappings. Also distinguish Mapped File from Nonpaged Pool, Process Private and memory compression; those categories point to different owners and tools.
- Healthy sign: most pages are Standby and reclaim under a controlled memory demand.
- Healthy sign: the total stabilizes after the workload finishes.
- Warning sign: Active pages rise after each identical action.
- Warning sign: a deleted, moved or temporary file remains heavily mapped by a running process.
- Warning sign: Modified pages and disk queue time rise together.
- Warning sign: the system becomes unresponsive while Available memory remains persistently low.
A screenshot with a large green or purple area does not prove a leak. Preserve the selected tab, column labels, totals, workload and time sequence.
Safe fixes for high Mapped File memory
The correct fix depends on the owner. Close or restart the application that actively maps the file, pause a scan or backup that repeatedly touches it, update a storage or filter driver when the pattern began after a driver change, and correct application cache settings when a product is configured to map more data than the machine can support.
If the pages are mainly Standby and the system has no pressure, the safest fix is no fix. Windows is using spare RAM as cache and can normally reclaim it. If you need a controlled test, create a before snapshot, apply one temporary action, measure the cold-cache penalty and allow Windows to repopulate the cache.
When one application owns the files
Save work, close the application normally and refresh RAMMap. Check the application's cache, project, database or memory-mapping settings before reinstalling it. If the mapping returns immediately, capture the file path and version for the vendor or administrator.
When security, backup or indexing is involved
Confirm schedules and exclusions rather than disabling protection permanently. A scan can legitimately read large datasets, but repeated rescans or filter-driver problems may create sustained I/O and memory pressure.
When storage writeback is slow
Check free disk space, storage health, event logs, filter drivers and write-heavy applications. Modified file-backed pages cannot become reusable until their data is handled safely.
Why Empty Standby List is not a permanent fix
RAMMap can empty the standby list, but that action only discards reclaimable cached pages at that moment. The underlying application or file workload can fill the list again, and the next reads may become slower because Windows must return to storage. This is why a lower number immediately after clearing is not proof of a repair.
Use the command only as a bounded diagnostic comparison when you understand the cold-cache cost. Do not schedule it at startup, every few minutes or before every game. The RAMMap cache-clearing guide explains the difference between Empty Working Sets, Empty System Working Set, Empty Standby List and the modified-page options.
Never empty modified pages casually. They may require writeback, and forcing state changes can hide evidence while increasing I/O.
When RAMMap is not enough
RAMMap is excellent for proving that physical pages are file-backed and for finding large file paths, but it may not identify every process, driver or causal event. Use Resource Monitor or Process Explorer for open handles and process context. Use Windows Performance Recorder and Analyzer when timing and I/O stacks matter. Use PoolMon when the growing category is Nonpaged Pool rather than Mapped File.
If RAMMap itself stops responding while scanning a very large system, use the RAMMap troubleshooting guide. Keep screenshots and exported snapshots from before and after the workload, plus Windows build, RAMMap version, file paths and storage-driver versions. That evidence is far more useful than repeatedly clearing memory.
RAMMap high Mapped File FAQ
Is high Mapped File memory a leak?
Not by itself. Mostly-Standby pages are commonly reclaimable file cache. Suspect a problem when Active pages grow repeatedly, available memory stays low, symptoms worsen and a file or workload can be correlated with the growth. Record Mapped File RAMMap beside its page state.
Why does Mapped File stay high after I close a program?
File data may remain on the standby list for reuse even after the process closes. That is normal if Windows can reclaim it. Active mappings that remain require checking services, child processes, handles and related components.
Can I safely empty the standby list?
It can be used as a temporary controlled test, but it is not a durable optimization. It removes cache, can slow later reads and does not fix the workload that repopulates it.
Which RAMMap tab shows the responsible files?
Use File Summary to rank file paths, then File Details to inspect the selected file's physical pages and states. Confirm process ownership with Resource Monitor or Process Explorer when needed.
Is Mapped File the same as memory compression or Nonpaged Pool?
No. Mapped File is file-backed memory, memory compression stores compressed pages in the System process, and Nonpaged Pool is resident kernel memory. Each category needs a different diagnostic path.
Inspect Mapped File with RAMMap v1.63
Download the current Microsoft Sysinternals archive, capture a baseline and inspect File Summary before changing memory state.