

Memory compression is normally an automatic Windows feature, not a leak. Check Task Manager and Get-MMAgent first, then use RAMMap to understand whether physical RAM is dominated by Process Private, Mapped File, Standby, pool or other categories. Disable compression only for a controlled comparison, record the before-and-after result, and turn it back on when the test is complete.
What Windows memory compression does
When memory pressure rises, Windows can compress selected pages and keep the compacted data in physical memory. Reading that data costs CPU time to decompress it, but this can be faster than retrieving pages from a slower page file. The feature is therefore a tradeoff between processor work, physical capacity and storage I/O rather than a promise to make memory usage disappear.
Compressed memory belongs to the operating system's memory-management behavior. A visible compressed value can grow during browsers, virtual machines, games, development tools or large file operations. The important question is not whether the number is nonzero; it is whether the system is paging heavily, becoming unresponsive, or showing a continuously growing owner that does not fall after the workload ends.
Do not confuse compression with standby memory. Standby pages contain cached data that Windows can reclaim. Compressed pages contain compacted data that must be decompressed before use. They can exist at the same time and require different interpretation.
Check compressed memory in Task Manager first
Open Task Manager, choose Performance, and select Memory. Windows normally shows the compressed amount inside the in-use memory details. Record total installed RAM, in-use memory, available memory, committed memory and the compressed value while the problem is happening. A screenshot captured after the workload closes can hide the evidence.
Next open the Processes tab and sort by Memory, but treat the list as a starting point rather than a complete accounting statement. Process columns do not always add cleanly to the Performance total because Windows also uses memory for the kernel, drivers, file cache, shared pages and system services. If one process grows steadily during a repeatable action, investigate that process before changing a global memory feature.
Use Resource Monitor or Performance Monitor when the issue depends on time. A short timeline showing available memory, paging activity and process growth is more useful than a single high percentage.
Confirm the MemoryCompression state with PowerShell
Run PowerShell as an administrator and use the command below. The MemoryCompression field reports whether the Windows memory-compression feature is enabled. This command checks configuration; it does not explain which workload created pressure or how much memory will be recovered by changing the setting.
Microsoft documents Get-MMAgent, Disable-MMAgent and Enable-MMAgent in the MMAgent PowerShell module. Use the official documentation when a command behaves differently on a managed or restricted computer. Group Policy, security controls or Windows editions can affect whether a change is allowed.
Get-MMAgentEnabled is the normal state on current Windows systems. A high compressed value alone is not evidence that the feature should be disabled.
What RAMMap can and cannot tell you about compression
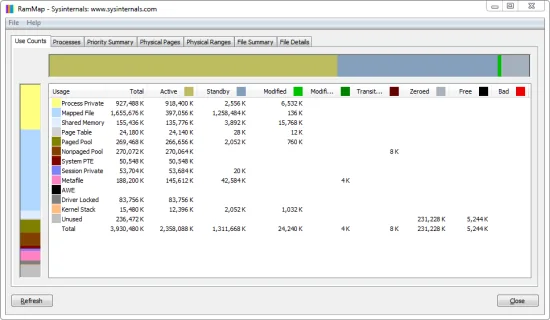
RAMMap is valuable because it explains how physical pages are distributed by use and page-list state. Start with Use Counts, refresh during the problem, and compare Process Private, Mapped File, Shareable, Paged Pool, Nonpaged Pool, Page Table, Metafile and the Standby columns. This helps separate application residency, file-backed cache and kernel growth.
RAMMap is not a replacement for Task Manager's compressed-memory display, and its categories should not be interpreted as a single direct compressed-memory counter. Use Task Manager or Windows performance counters for the compressed amount, then use RAMMap to identify the surrounding physical-memory pattern. The two views answer different questions.
If Process Private dominates, move to the Processes tab. If Mapped File is mostly Standby, inspect File Summary before clearing anything. If Nonpaged Pool grows, preserve the trend and investigate drivers or pool tags. The RAMMap memory types guide explains these rows and columns in detail.
Diagnose high RAM usage without blaming compression
Build a small evidence set: the workload that triggers the problem, Task Manager totals, the compressed amount, committed memory, page-file activity and a refreshed RAMMap Use Counts view. Repeat the same action after a reboot or clean start if possible. Consistent growth in the same category is more actionable than a one-time spike.
High in-use memory with healthy available memory and little paging may reflect normal caching or an intentionally large workload. Low available memory with rising committed memory and sustained disk paging deserves closer investigation. A continuously growing process, pool or mapped-file pattern points toward an owner; a stable compressed value may simply be Windows responding to the pressure.
Avoid using Empty commands as the first measurement. Emptying standby pages or working sets changes the state you are trying to diagnose and can make the next launch slower. Capture the baseline first, then follow the controlled steps in the RAMMap clear cache guide only when the test has a defined question.
| Observed pattern | Likely interpretation | Next action |
|---|---|---|
| Compressed memory rises, system remains responsive | Windows is retaining more pages in compressed form | Monitor paging and workload; do not change settings yet |
| One process grows with every repeat | Application private memory or leak candidate | Capture reproduction steps and process trend |
| Mapped File is large and mostly Standby | Reclaimable file-backed cache is likely | Use File Summary and avoid routine clearing |
| Nonpaged Pool grows continuously | Kernel or driver allocation may be involved | Use PoolMon or performance tracing |
| Committed memory approaches the limit | Workload demand exceeds RAM plus page-file headroom | Reduce workload or review page-file and capacity |
Should you disable memory compression?
For normal use, leave memory compression enabled. Disabling it can increase page-file traffic and may make the system slower under pressure. It does not fix an application leak, a driver leak, an undersized workload configuration or a failing storage device. Advice that promises more free RAM by disabling the feature usually ignores these tradeoffs.
A temporary disable test can be reasonable when troubleshooting a reproducible performance problem and you can compare the same workload before and after. Record boot state, available memory, compressed memory, commit, hard faults or paging, CPU use and elapsed task time. Restart if Windows requests it, and do not compare different workloads.
Use an elevated PowerShell window. After the test, re-enable the feature and verify the state with Get-MMAgent. On managed computers, coordinate with the administrator instead of bypassing policy.
- Disable-MMAgent -MemoryCompression
- Enable-MMAgent -MemoryCompression
- Get-MMAgent
A safe RAMMap and memory-compression test workflow
Use the sequence below to preserve evidence and avoid accidental conclusions. The goal is to identify the owner of pressure, not to make a memory graph look lower for a few minutes.
- Define the symptom
Write down the application, action, time to slowdown and whether storage activity or CPU usage rises.
- Capture Windows totals
Record in-use, available, committed and compressed memory in Task Manager while the issue is active.
- Refresh RAMMap
Open Use Counts and note the largest rows and whether their pages are Active, Standby or Modified.
- Attribute the category
Use Processes for private memory, File Summary for mapped files, or pool and driver tools for kernel growth.
- Change one variable
Only after the baseline, run one controlled test such as closing the owner, changing workload size or temporarily toggling compression.
- Restore and compare
Re-enable memory compression if it was disabled, repeat the same workload and keep the evidence that explains the result.

RAMMap version and official source checked for this guide
This software-download site completed its version freshness check on July 19, 2026. Microsoft's current RAMMap page still lists v1.63, published March 26, 2026, with a 719 KB official ZIP for Windows 11 and supported Windows Server releases. The site's version, download CTA and package details already match, so no version-field migration was required.
Download only from the Microsoft Sysinternals RAMMap page or its official download.sysinternals.com link. This site does not host or repackage the archive. Use the RAMMap verification guide to check the source, signature and current package before approving elevation.
Windows memory compression FAQ
Is Windows memory compression bad?
No. It is a normal memory-management feature. Investigate responsiveness, paging and the owner of memory growth instead of treating any compressed value as an error.
Why is compressed memory high in Windows 11?
Windows may be responding to pressure from applications, file activity or background services. Compare the compressed value with available memory, commit, paging and RAMMap categories.
Does RAMMap show compressed memory directly?
Use Task Manager or Windows counters for the compressed amount. RAMMap is best used to explain the surrounding physical-memory categories and page-list states.
Will disabling memory compression free RAM?
It may change where Windows keeps pages, but it can increase paging and does not fix the underlying owner. Use it only as a temporary controlled test.
Is RAMMap v1.63 still current?
Yes. Microsoft's page checked on July 19, 2026 still lists v1.63, published March 26, 2026, with a 719 KB ZIP.
Open RAMMap v1.63 from Microsoft
Use the official Sysinternals ZIP, then compare Task Manager's compressed-memory value with RAMMap Use Counts.