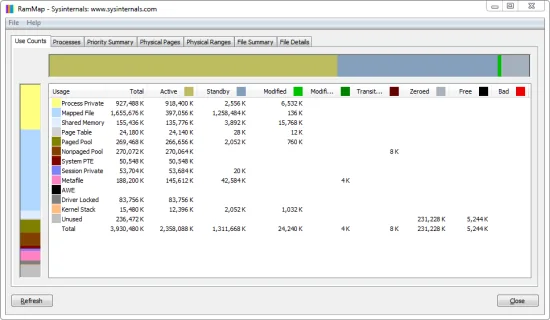
Start on Use Counts and confirm that Process Private is large in the Active column, not merely surrounded by a large Standby cache. Then open Processes, sort by the private-memory column, record the leading processes and save a snapshot. Repeat the same workload and compare again. If one process rises continuously while available memory falls, investigate that application with Task Manager, Process Explorer or VMMap; do not use Empty Standby List as a fix for private committed memory.
What Process Private means in RAMMap
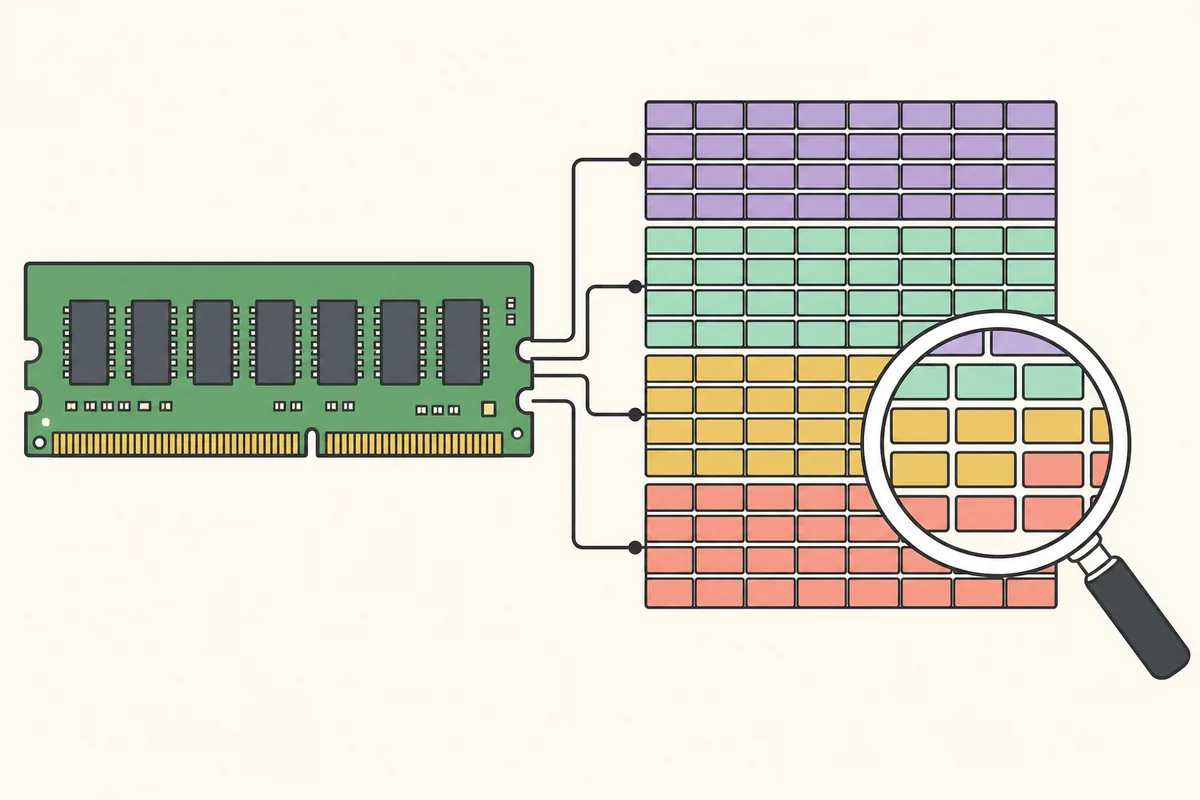
RAMMap classifies physical pages by use and by page-list state. Process Private is memory committed for a process that is not primarily backed by a normal mapped file and is not shareable with unrelated processes. It commonly includes heaps, stacks, runtime allocations, decoded data, in-memory documents, browser tab state, game assets and private copy-on-write pages.
The value is broader than one application's simple working-set number. A process can own committed private memory even when some pages are not currently resident in physical RAM. Conversely, Task Manager may show a working set that also contains shared or file-backed pages. That is why totals from RAMMap, Task Manager and Process Explorer may be related without matching exactly.
Treat Process Private as a classification clue, not a verdict. A video editor, virtual machine, database, browser or game can legitimately hold many gigabytes while doing useful work. The warning pattern is sustained growth across repeatable checkpoints, especially when the workload has stopped changing and Windows is losing available memory or paging heavily.
Confirm that Process Private is the real pressure source
Pause downloads, game updates, virtual-machine startup and other noisy tasks. Run RAMMap as administrator, press F5 and record Total, Active, Standby, Modified, Free and the Process Private row. Also note Task Manager's Memory percentage and the system commit charge. A single screenshot is not enough; you need a baseline that can be compared with the same workload later.
Look first at the Active column for Process Private. A large overall memory graph can be dominated by Standby or Mapped File cache, which Windows can normally reclaim. If Process Private is stable while Standby changes, the problem is not a growing private allocation. If Process Private Active rises together with commit charge and available memory falls, continue to the process-level check.
Do not compare values captured after different reboots, application versions or workloads and call the difference a leak. Reproduce one action, wait the same amount of time and refresh at the same checkpoints. For a general orientation to every category, read the RAMMap memory types guide.
| Signal | Usually normal | Needs investigation |
|---|---|---|
| Process Private trend | Rises during work, then levels off or falls | Keeps rising after the same task is idle or repeated |
| Available memory | Remains adequate and the system is responsive | Falls steadily while paging or stalls increase |
| Leading process | Known workload explains the allocation | Unknown process or one app grows without useful work |
| After closing the app | Most private commit is released | Memory remains committed because a service, child process or driver continues |
| Mapped File or Standby | Changes independently as cache warms | Is mistaken for Process Private and triggers the wrong cache-clearing action |
Find which process is using private memory
Open RAMMap's Processes tab and sort the private-memory or total columns so the largest consumers appear first. Record the process name, PID and value. Refresh after the action that causes growth. If the same PID gains memory at each checkpoint, you have a useful lead. If the process exits and a new PID appears, identify the parent service, launcher or scheduled task instead of treating each instance as unrelated.
Cross-check the result in Task Manager's Details tab or Microsoft Process Explorer. Add columns such as Private Bytes, Working Set, Commit Size and PID. Private Bytes is especially useful because it follows committed private allocations rather than only resident pages. Process Explorer can also reveal child processes, command lines, verified publishers and services hosted inside shared executables.
RAMMap is best at explaining physical-page composition; it is not an allocation-stack debugger. When a process is confirmed, VMMap can split its address space into heap, stack, image, mapped file and other regions. For a managed application, the vendor's profiler or runtime tools may be required to identify the object or code path retaining memory.
- Capture a quiet baseline
Refresh RAMMap and note Process Private Active, available memory and commit charge before starting the suspect task.
- Repeat one action
Open the same project, level, document or browser workflow and wait a consistent interval.
- Sort the Processes tab
Record the leading process, PID and private-memory change instead of relying on the system total alone.
- Cross-check another tool
Use Task Manager or Process Explorer to verify Private Bytes and identify services or child processes.
- Save evidence before restarting
Keep snapshots, timestamps and reproduction steps so an application update or support team can compare the same state.
Compare RAMMap snapshots instead of watching one number
Choose File > Save to preserve a RAMMap snapshot before the workload, after one repetition and after several repetitions. Use descriptive filenames with the time and step, such as baseline, after-import-1 and after-import-5. Snapshots are more reliable than memory estimates copied from screenshots because they preserve the category breakdown for later comparison.
A useful test asks whether the delta is repeatable. If Process Private grows by roughly the same amount every time an operation runs and does not return after the operation completes, the pattern is stronger than a one-time jump. If growth stops after caches, pools or application warm-up stabilize, the allocation may be intentional. Keep the test short enough to avoid severe paging.

Why clearing standby cache does not fix high Process Private
Empty Standby List changes reclaimable cached pages. It does not tell an application to release committed private allocations, repair a leak or reduce the program's requested commit. The memory graph may look different for a short time because file cache was discarded, but the Process Private owner remains and Windows may need to read the same files again.
Empty Working Sets can trim resident pages from processes, which may create an immediate visual drop and then cause page faults as applications touch those pages again. It does not prove that the underlying private allocation disappeared. Repeatedly trimming working sets can make performance worse and hide the trend you were trying to measure.
Use the Empty menu only for a defined experiment described in the RAMMap clear cache guide. For high Process Private, the durable response is to identify the owner, stop unnecessary work, update or reconfigure the application, remove a faulty extension, correct the workload or provide the vendor with reproducible evidence.
Do not schedule RAMMap cache-clearing commands as a treatment for private memory growth. A lower graph immediately after trimming is not proof that a leak was fixed.
Choose a safe fix based on the process you identify
For a normal foreground application, save work, close the specific document or workload and check whether Private Bytes falls. Then install the current supported application update, test without optional plug-ins or overlays and reduce unusually large inputs. Browser cases often require comparing tabs, extensions and profiles rather than repeatedly clearing Windows memory.
For a background service, confirm its display name and executable path before restarting it. Review recent configuration changes, log growth, indexing jobs, backup tasks, security scans or synchronization queues. Restarting a service may restore capacity but should be followed by a root-cause check because the private allocation can return.
If a Microsoft-signed service host is large, use Process Explorer to identify hosted services and verified paths. More RAM can reduce paging for a valid workload, but it does not correct an unbounded leak.
- Restart only the confirmed application or service when possible, then verify whether the same workflow reproduces the growth.
- Update the application, plug-in, driver or runtime through its official source; avoid generic driver-updater tools.
- Test with optional extensions, overlays, mods or large inputs disabled one group at a time.
- Preserve RAMMap snapshots and Process Explorer values before making major configuration changes.
When RAMMap is not enough
Switch tools when the question becomes more specific than physical-page classification. Use Process Explorer for ownership, services, command lines and Private Bytes. Use VMMap for one process's address-space breakdown. Use Resource Monitor for hard faults and use Windows Performance Recorder when the issue involves a timeline or suspected driver. Do not confuse Process Private with Mapped File, Nonpaged Pool, Driver Locked or memory compression.
For production servers, virtual machines or business-critical workstations, follow the application's support procedure before forcing dumps or restarting services. Memory dumps and performance traces can contain document names, paths and other sensitive data. Store them securely and share them only through the vendor's approved support channel.
The current verified RAMMap release remains v1.63, published by Microsoft on March 26, 2026. This site checked the official Microsoft RAMMap page on July 23, 2026. Use the official ZIP or the exact WinGet package rather than an unsigned mirror.
Process Private RAMMap FAQ
Is high Process Private in RAMMap a memory leak?
Not by itself. Large applications can legitimately commit substantial private memory. Suspect a leak when the value rises across repeatable checkpoints, the workload is no longer changing, available memory falls and the same process also shows increasing Private Bytes.
Which RAMMap tab shows the responsible process?
Start with Use Counts to confirm the category, then use the Processes tab and sort the private-memory or total columns. Cross-check the PID and Private Bytes in Task Manager or Process Explorer.
Will Empty Standby List reduce Process Private?
No. It discards reclaimable standby cache. It does not make an application release committed private allocations, so it is not a fix for Process Private growth.
Why does Task Manager not match RAMMap Process Private?
The tools group memory differently. Task Manager working set can include shared and file-backed resident pages, while Private Bytes tracks committed private allocation and RAMMap classifies physical pages by use and state. Compare trends rather than expecting identical totals.
What tool should I use after RAMMap?
Use Process Explorer to identify ownership and Private Bytes, VMMap to inspect one process's address space, and Windows Performance Recorder when you need a system timeline or driver-level evidence.
Inspect Process Private with RAMMap v1.63
Download the current Microsoft Sysinternals ZIP, capture a quiet baseline and compare the same workload before changing memory state.