
Yes. Microsoft lists RAMMap for Windows Server 2008 and later, so Windows Server 2019 is inside the documented range. Use the official v1.63 ZIP, extract the complete archive, choose RAMMap64.exe for a normal x64 Intel or AMD server, and run the GUI with appropriate elevation. Server Core does not provide the same full desktop-shell workflow as Desktop Experience, so do not assume that a local RAMMap window is available there.
Is RAMMap supported on Windows Server 2019?
The official RAMMap documentation lists Windows Server 2008 and later. That broad range includes Windows Server 2019, but the support statement should not be stretched into a promise that every server installation mode or every remote-management pattern behaves like a full Windows desktop.
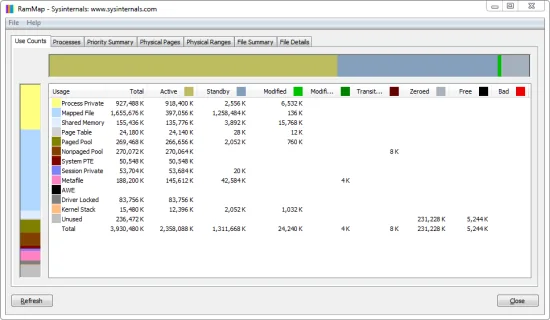
For a local investigation, treat RAMMap as a portable graphical observer of physical-page usage. Start with a quiet baseline, record the server build and workload, and keep the tool's view separate from the change you are trying to explain. The real RAMMap Use Counts window below is useful for classifying pages, but it is not a replacement for long-duration counters or an application diagnostic trace.
| Environment | What the documented range means | Practical choice |
|---|---|---|
| Windows Server 2019 | Included in Windows Server 2008 and later | A valid starting point for RAMMap analysis |
| Desktop Experience | The full graphical shell is available | Use when the RAMMap window must run locally on the server |
| Server Core | A minimal installation without the full desktop shell | Prefer built-in counters, PowerShell or a supported management workflow |
| x64 server hardware | The normal Intel or AMD 64-bit case | Run RAMMap64.exe |
| ARM64 hardware | Only when the operating system and hardware are ARM64 | Run RAMMap64a.exe |
Desktop Experience vs Server Core
Server Core is the minimal Windows Server installation option. It intentionally omits the full desktop shell, so the usual local RAMMap workflow—launching a window, selecting a tab and reading the grid—should be planned around Desktop Experience or another supported administration path rather than assumed to work unchanged on Server Core.
This boundary is about the user interface and operating procedure, not a claim that Server Core is an unsupported operating system. If the server is Core-only, use Performance Monitor, Windows counters, PowerShell and the server's normal telemetry for collection, or follow an approved management design. Do not advertise RAMMap as having a built-in remote-target mode when the page has not verified one.
| Question | Desktop Experience | Server Core |
|---|---|---|
| Need the RAMMap window locally? | Predictable GUI workflow | Do not assume the full GUI is present |
| Need ongoing monitoring? | Pair RAMMap snapshots with counters | Use native counters and approved telemetry |
| Need a one-off physical-memory view? | Run an elevated, controlled snapshot | Use the server's supported diagnostic tools |
| Need to change memory state? | Document the test and approval first | Avoid unverified cleanup commands |
The safest wording is “RAMMap is in the Windows Server 2008-and-later range; Desktop Experience is the predictable local GUI workflow.” It does not promise a local RAMMap window on every Server Core installation.
Which RAMMap executable should you run?
The verified v1.63 archive contains RAMMap.exe, RAMMap64.exe, RAMMap64a.exe and Eula.txt. A normal Windows Server 2019 installation on Intel or AMD hardware is x64, so RAMMap64.exe is the practical default. RAMMap64a.exe is for Windows on ARM, while RAMMap.exe is the 32-bit build; the file name alone is not a reason to run the wrong architecture.
Download the archive from the RAMMap installation guide or the official Microsoft ZIP, extract the complete set to a controlled folder and keep the executable files from one release together. If the version or architecture is unclear, return to the RAMMap version guide before collecting evidence.
| File | Use it when | Server 2019 note |
|---|---|---|
| RAMMap64.exe | x64 Intel or AMD Windows | Expected choice for most servers |
| RAMMap64a.exe | ARM64 Windows | Use only with an ARM64 OS and processor |
| RAMMap.exe | 32-bit Windows | Not the normal Server 2019 case |
| Eula.txt | Reviewing the distribution terms | Keep it with the extracted archive |
A safe setup workflow for a server
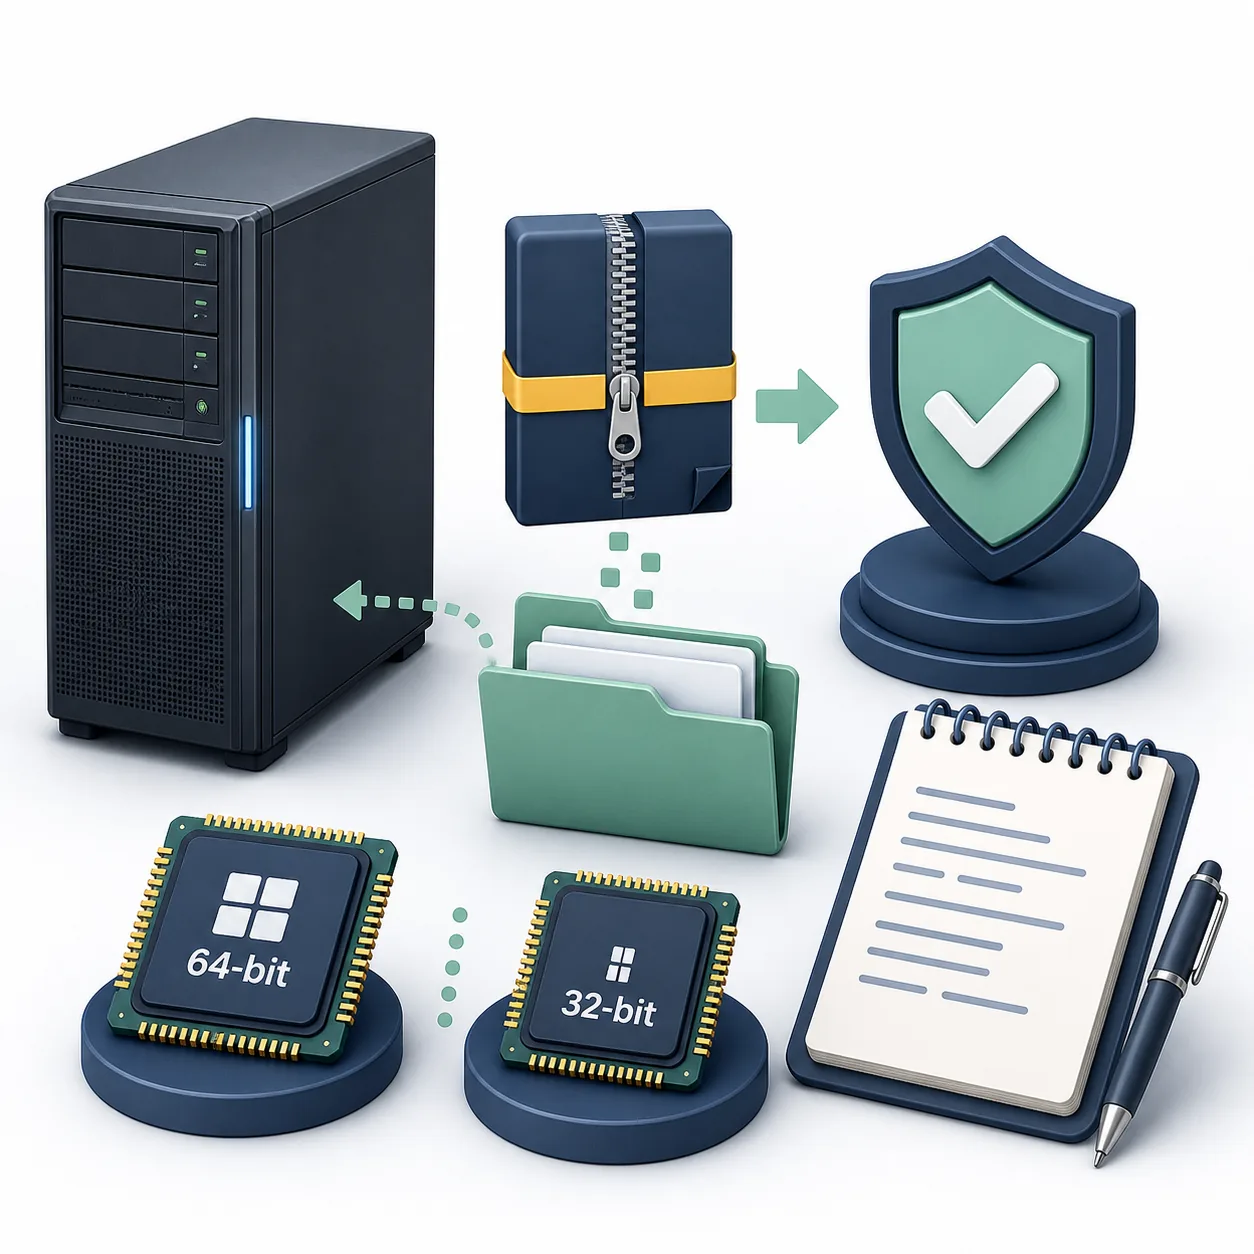
A server memory investigation is easier to reproduce when the setup is boring and explicit. The current Microsoft archive is a portable ZIP, not a background service. Record the server identity, workload, time and architecture before you open a detailed view, then preserve the original archive and any snapshots separately from the working folder.
The RAMMap safety guide covers source, checksum and signature checks in more detail. The short workflow below keeps the diagnostic question visible and prevents an Empty command from being mistaken for a fix.
- Record the baseline
Note the Windows Server build, installed memory, processor architecture, current workload, time and the symptom you are testing.
- Verify the source
Use Microsoft Learn and the official Sysinternals ZIP. For v1.63, the checked archive is 737,190 bytes and has SHA256 6536A8107A3FB391E4443F2742366067341A7DA50DE89F99CA0B2390120DD0CC.
- Extract one release
Unzip the complete archive to a controlled folder. Do not mix RAMMap64.exe or RAMMap64a.exe from different releases.
- Run with appropriate elevation
Start the architecture-matched executable as an administrator when the investigation needs system-wide physical-memory visibility, following your change and access policy.
- Capture before changing anything
Start with Use Counts, then move to Processes, Priority Summary or File Summary based on the large category. Save notes before any Empty action.
Do not empty standby, working-set or system-working-set pages as routine server maintenance. A cleanup action changes the state you are trying to measure and can create disk-read noise.
What RAMMap can and cannot prove
RAMMap is strongest at answering “which physical-page category is large right now?” It can narrow the next question to processes, mapped files, priorities, standby pages or kernel-related categories. It cannot, by itself, prove that an application has a leak, explain every commit decision or replace a long-running performance trace.
Use the RAMMap memory types reference to decode labels, then choose a follow-up tool that matches the suspected allocation path. For an application leak, correlate repeatable snapshots with process counters; for a kernel pool issue, use an appropriate pool or performance investigation.
| Observation | Useful RAMMap view | Follow-up boundary |
|---|---|---|
| Process Private is growing | Use Counts and Processes | Confirm process commit and working-set growth with process tools |
| Mapped File is large | File Summary and File Details | Separate active mappings from reclaimable cache |
| Standby is large | Use Counts and priority views | Treat it as reclaimable cache, not automatically a leak |
| Kernel or driver category is high | Use Counts and physical-page context | Move to pool, driver or performance diagnostics |
| The server is slow over hours | Use RAMMap for checkpoints | Use counters, tracing and workload evidence for duration |
A repeatable Server 2019 investigation checklist
Use the same workload step and the same observation order when comparing two checkpoints. A useful record contains the exact RAMMap version, executable architecture, Windows Server build, installed memory, active workload, timestamp and the tab or category that changed. This makes a later comparison more useful than a single colorful screenshot.
If RAMMap freezes or fails to open, stop treating the missing view as evidence about server memory. Follow the RAMMap not opening checklist, verify that the extracted files match one archive and record the error. If the issue is a refresh failure, use the refresh database troubleshooting guide.
- Keep a quiet baseline before the workload step.
- Repeat the same workload step instead of changing several services at once.
- Compare categories and timestamps, not colors alone.
- Preserve the ZIP checksum and executable architecture with the notes.
- Escalate to Performance Monitor, tracing, pool or vendor tools when RAMMap cannot identify the allocation path.
winget show Microsoft.Sysinternals.RAMMapRAMMap on Windows Server 2019 FAQ
Does RAMMap work on Windows Server 2019?
Yes. Microsoft lists RAMMap for Windows Server 2008 and later, which includes Windows Server 2019. The local workflow still depends on the installation mode and available graphical shell.
Can I run the RAMMap window locally on Server Core?
Do not assume the full local GUI workflow is available on Server Core. Desktop Experience is the predictable choice for a local RAMMap window; Core-only servers should use native counters, PowerShell or an approved management design.
Which RAMMap file should I use on a normal Server 2019 machine?
Use RAMMap64.exe for a normal x64 Intel or AMD server. Use RAMMap64a.exe only for Windows on ARM64 and RAMMap.exe only for 32-bit Windows.
Does RAMMap replace Performance Monitor?
No. RAMMap gives a detailed physical-page view at a point in time. Pair it with counters or tracing when the question involves duration, throughput, latency or a process allocation path.
Should I empty standby memory on a production server?
Not as routine maintenance. Empty actions change the state and can hide the evidence you need. Use them only for a documented, approved diagnostic experiment.
Download RAMMap for the Server 2019 workflow
Get the checked Microsoft Sysinternals v1.63 ZIP, then choose the executable that matches the server architecture.