
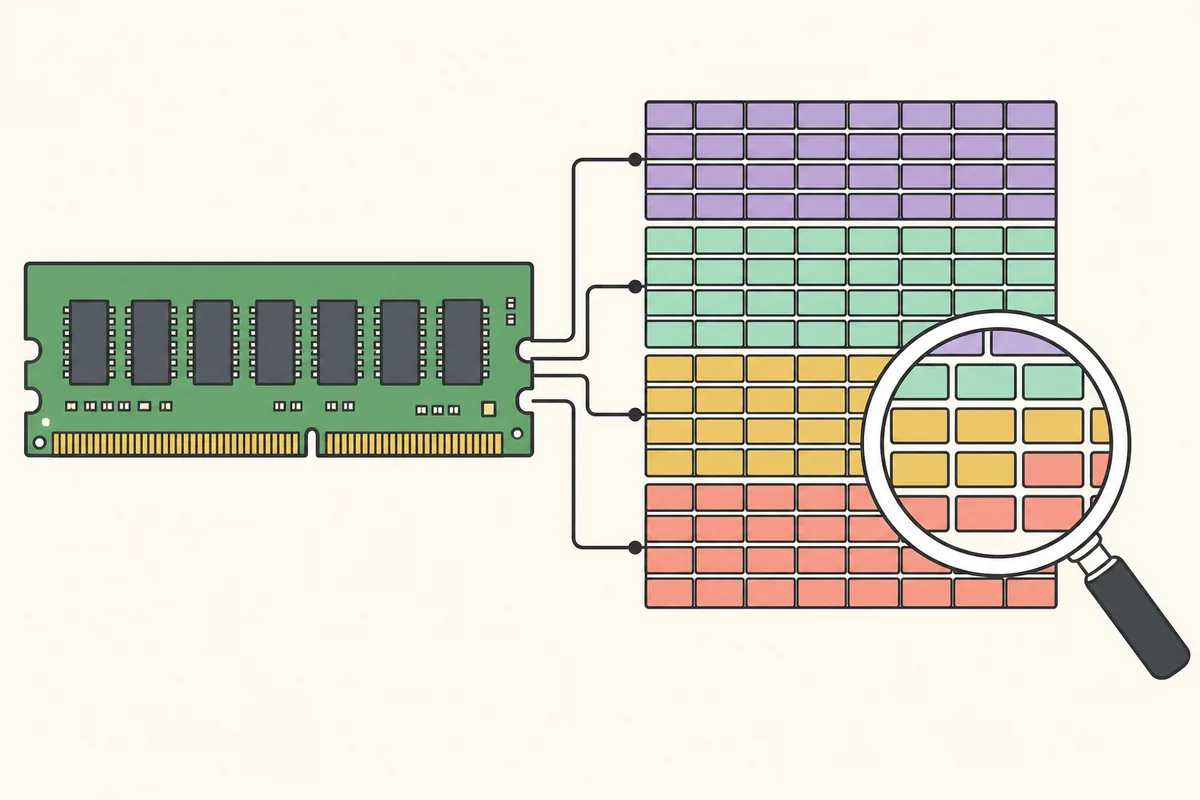
RAMMap does not have a genuine macOS edition. Do not download a file advertised as RAMMap for Mac unless Microsoft publishes one. Use Activity Monitor for Memory Pressure and per-process usage, memory_pressure for system pressure, vm_stat for virtual-memory page counters and Instruments for application allocations.
Why RAMMap is Windows-only
Microsoft describes RAMMap as a Windows physical-memory usage analyzer. Its Use Counts, page-list states, kernel pools, mapped-file views and physical-page data come from Windows interfaces and Windows memory-manager concepts. A native macOS program would need different APIs and terminology.
Running RAMMap.exe through Wine or another compatibility layer would at best expose the compatibility environment's Windows-facing behavior, not a trustworthy map of the macOS kernel's physical memory. A Windows virtual machine can run RAMMap, but it analyzes memory assigned inside that virtual machine, not the host Mac's complete physical memory.
A website offering a special RAMMap.dmg or RAMMap for Mac installer is not providing the standard Microsoft Sysinternals Windows archive. Treat the file as unrelated until its publisher and provenance are independently verified.
Use Activity Monitor as the first Mac alternative
Open Activity Monitor, choose the Memory tab and start with the Memory Pressure graph. Green generally indicates that macOS is meeting memory demand efficiently. Yellow or red pressure, persistent swap growth and poor responsiveness provide stronger evidence of shortage than the amount labeled Memory Used by itself.
Sort processes by Memory to find large consumers, but remember that shared resources, compressed memory and application behavior complicate simple totals. Inspect a process and reproduce the workload before force quitting it. macOS also uses available memory for caching, so a high used number is not automatically a problem.
| Diagnostic goal | Windows RAMMap approach | macOS starting point |
|---|---|---|
| Overall pressure | Use Counts and page lists | Activity Monitor Memory Pressure |
| Large process | Processes tab | Activity Monitor Memory column |
| Page counters | Use Counts list totals | vm_stat |
| System pressure test | Refresh and compare | memory_pressure |
| Application allocations | Process-focused comparison | Instruments Allocations or Leaks |
| File cache detail | File Summary | No direct one-to-one built-in equivalent |
Use memory_pressure and vm_stat for detail
The memory_pressure command reports system memory-pressure information using macOS metrics. The vm_stat command prints virtual-memory statistics including page counts. Because page sizes and categories matter, do not compare raw values with RAMMap rows as though the names were interchangeable.
Check memory pressure
Run memory_pressure in Terminal for a current pressure summary. Use the manual page on your installed macOS version because options and presentation can evolve.
Inspect virtual-memory counters
Run vm_stat and record two samples around the workload. Look at page-ins, page-outs, compression and swap together rather than turning one counter into a diagnosis.

Use Instruments for a Mac application leak
If one application appears to grow repeatedly, Apple's Instruments is closer to a developer investigation than RAMMap. Allocations can show live and persistent allocations, while Leaks can identify particular leak patterns. Use a reproducible workflow and symbols from a build you are authorized to inspect.
For a third-party application, gather Activity Monitor evidence, app version, macOS version and reproduction steps before contacting the developer. Force quitting can recover responsiveness but removes part of the evidence and does not identify the allocation path.
Choose a RAMMap for Mac alternative by diagnostic question
Start with the symptom instead of searching for a single clone. A RAMMap for Mac alternative should preserve the diagnostic question, not copy a Windows label. If the Mac feels slow under load, Activity Monitor's Memory Pressure graph and swap figures provide a system-level starting point. If one process grows, sort the Memory tab, reproduce the workload and inspect that application before moving to developer tools.
Use vm_stat when you need repeated page counters that can be recorded over time. A RAMMap for Mac alternative for this question must expose changing page counters, so capture the same interval before and during the workload and convert page counts using the reported page size. Use memory_pressure when the question is whether macOS can satisfy current demand efficiently rather than which Windows-style page list is large.
For software you develop, Instruments can connect the symptom to allocations, object lifetimes and leak patterns. A RAMMap for Mac alternative for application diagnosis should expose native allocations rather than imitate Windows page lists. For storage-cache or kernel questions without a direct built-in equivalent, define the required evidence first and select a specialized macOS or Apple developer diagnostic.
This question-led approach preserves the investigative goal while replacing the Windows-specific data source. It also avoids installing a misleading third-party port merely because it copies the RAMMap name.
| Question | Start with | Escalate when |
|---|---|---|
| Is the Mac under pressure? | Activity Monitor Memory Pressure | Record memory_pressure and swap behavior |
| Which process is large? | Activity Monitor Memory tab | Use Instruments for an app you develop |
| How do page counters change? | vm_stat samples | Correlate with the exact workload interval |
| Is a Windows guest using its assigned RAM? | RAMMap inside the Windows VM | Return to macOS tools for host pressure |
When RAMMap still makes sense on a Mac
RAMMap is useful on a Mac only when you are diagnosing a supported Windows installation, such as Windows running in a virtual machine. Install RAMMap inside Windows, choose x64 or ARM64 according to that Windows guest and interpret the results within the guest's assigned memory boundary.
On Apple silicon, a Windows 11 ARM virtual machine uses the ARM64 build RAMMap64a.exe. On an Intel Mac running x64 Windows, use RAMMap64.exe. The utility cannot see memory outside the guest allocation, so return to macOS tools for host pressure.
Avoid fake RAMMap for Mac downloads
Microsoft's verified archive is a Windows ZIP containing .exe files. Do not trust a DMG, PKG or macOS app solely because it uses the RAMMap name or copies Microsoft branding. Check the official Microsoft documentation before installing any claimed port.
A legitimate Mac memory tool should identify its actual developer, supported macOS versions, code-signing identity and privacy behavior. It should not imply that Microsoft's Windows executable was silently converted into a native Mac application. Prefer built-in diagnostics until a third-party need is clear.
If your actual target is a Windows PC, use the Windows RAMMap installation guide. If you are comparing terminology, the RAMMap memory types reference explains the Windows concepts without pretending they are direct macOS equivalents.
RAMMap for Mac FAQ
Can I download RAMMap for Mac?
No native Microsoft RAMMap build for macOS is available. The genuine archive contains Windows executables.
Will RAMMap work with Wine on macOS?
It would not provide a reliable view of the macOS kernel's physical memory. Use native macOS diagnostics instead.
What is the closest Mac equivalent to RAMMap?
Activity Monitor is the best first tool for pressure and processes. Add memory_pressure, vm_stat and Instruments depending on the question.
Can RAMMap analyze Windows in a Mac virtual machine?
Yes, from inside the Windows guest. It sees the guest's assigned memory, not all host Mac memory.
Which RAMMap build works in Windows 11 ARM on Apple silicon?
Use RAMMap64a.exe inside the ARM64 Windows guest.
Need RAMMap for a Windows machine?
Download the current Microsoft ZIP only for a supported Windows client or server.